
High density mixed use efficient and comfortable new urban district in Tallinn
Academic year 2019-20 Fall semester – Students EAUI71 - 8 ECTS credits
Studio leader: Dr. Francesco De Luca. Lecturer: Arch. Ivan Gavrilov
Monday 08:45-11:45 Computer lab U03-217 Mustamäe campus
Friday 10:30-12:00 Computer lab U03-217 Mustamäe campus (Tõnismägi class 42)
Syllabus
Introduction
Contemporary cities in Europe are inhabited by almost 80% of the total population, demands for nearly 75% of total energy and account for the production of 75% of total CO2 emissions. The growth of population living in cites will continue steadily for many years to come. Scientists agree that combustion of fossil fuels is changing dramatically and irreversibly climate patterns increasing global warming.
The deadline of end 2020 is approaching, after which the European Union Directive 2010 art. 9 which states that all new buildings will have to be nearly-Zero Energy Buildings, will come into force. In the design of new residential and office buildings the orientation, distance and surrounding urban pattern together with envelope characteristics such as material and size of glazed areas and presence of shading, have a direct relation with the daylight and energy performance of the buildings.
Contemporary cities alter local climate conditions which significantly influence pedestrians making our urban environment uncomfortable. In the warm season the increase of air temperature and surface temperature of buildings, pavements and streets decreases the comfort of people in public areas and increases the cooling energy consumption of buildings. At northern latitudes in urban environments the exploitation of solar radiation during winter times can help increase the comfort of people, whereas building overshadowing and increased wind velocities can significantly increase discomfort due to low perceived temperatures hence specific urban design strategies are required.
Urban comfort, interiors daylight and buildings energy efficiency are strictly related and dependent from urban morphology, i.e. buildings size, orientation and distance. Architects and planners are urged to improve the performance of buildings for occupants’ comfort and energy efficiency and the comfort and safety of urban environments.
Scope of the course is the realization of design proposals by students for a new urban quarter located in the quarter of Sikupilli, Tallinn. The new quarter will be a high density cluster of residential and office buildings. The designed urban quarter will be architecturally sound and will fit the urban area and surroundings. The cluster buildings will receive enough natural illumination and will fulfill the Estonian requirements of low energy consumption. The public areas around and between the buildings will be comfortable and safe. Though it is a high density quarter green areas and open public areas will be integral part of the design proposal.
Area
The area used as planning area is characterized by businesses activities, warehouses buildings and large parking lots functional to the businesses. It is an area with strong potentiality for actual future developments. The area is bordered by the streets Pallasti, Sikupilli, Tuha and Majaka põik. The area is visible in Figure 1.

Figure 1. The Sikupilli quarter and the design area for the new urban district inside the red border.

Figure 2. The 3D model to use for project development available for download.
Studio
The course will be conducted as a design studio. It will consist of lectures, tutoring and team work to be conducted in the lab with the assistance of the lecturers when necessary. Most part of the work to finalize the project proposals will be conducted in the lab. The software used for design and simulation is and will be available on the computers of the lab. Additionally, students can install the software on their own laptop if need to continue to work at home. Most of the software is free or has educational (free) licenses. The software used will be: Rhinoceros and Grasshopper for parametric design (website), Urban Modeling Interface UMI for daylight and energy simulations (website), Ladybug Tools for urban comfort analysis (website). It is possible additional software will be used during the course. The software used for rendering, image editing and presentation board layout can be any decided by students.
Teams
The projects will be developed by students in teams. Each team is composed by 2 students. In few cases 3 students can form a team. It is advisable that the teams are formed in a way that, if possible, one member has already skills in using the parametric software Grasshopper (and in case additionally skills in using the plug-in Ladybug Tools for urban comfort analysis).
Activities
The course is divided in different activities, each one with a specific outcome. Some activities overlap and are carried on totally or partially in parallel, others are consequential (the outcome of one is used as starting data of the next). During the course theoretical lectures about urban design and performance design relative to the ongoing activity are given (not yet in schedule). During the different activities large quantity of time is given to team work with the possibility to take advantage of tutoring and lecturers.
Urban layout development - Activity in which the planning project is developed, its robustness and fitness verified with the lecturers. The urban layout development start with a project idea represented by bi-dimensional diagrams. The diagram express the possible linkage of the project idea to the site and surrounding urban morphologies. The three-dimensional urban layout validity is verified through generation of different alternatives using parametric design.
Parametric design of urban layout – During this activity practical lectures about how to design parametric models of urban layout are given.
Parametric modeling of urban layout alternatives - Teams will develop urban layout alternatives using parametric design. The design outcome quality is assessed together with the lecturers during the Urban layout development activity. Validity and appropriateness is assessed not for every urban layout alternative but for the model that generates it on the basis of few cases. This activity ends with a general review of all the teams which will present the project idea (diagrams), the urban layout generation process and urban layout alternatives (Interim review 1).
Daylight and energy performance analysis - During this activity lectures about daylight simulations of urban models and energy simulations using Urban Building Energy Modeling (UBEM) are given. The simulations will be used by the teams to assess the performance of urban layout alternatives with respect to daylight availability and energy consumption. The scope is to produce a number of alternatives that meet the requirements and even perform better. Each team will select, also on the basis of the lecturers input, one final layout, among those that meet the requirements, to use for urban comfort analysis and final urban design proposal development.
Urban comfort performance analysis – After having selected one final layout each team will locate the area, small portion of the entire project, on which develop the public open area design. It must be an area between buildings where a public area as a square can be located. During this activity lectures about Urban comfort analysis are given. The teams will perform the simulations and will use the results of the analysis to locate terraces, pedestrian paths, playgrounds, green areas, free time areas and entrances to surrounding buildings, features that constitute the public open area design.
Performance analysis presentation – During this activity lectures are given to students about how to properly present results of performance analysis for an architectural project. It will be important that project presentations will show how the performance analysis results have guided design decisions. During this activity the teams will have the possibility to develop analysis presentation for the relative drawing boards.
Urban project and open area design + presentation – During this activity the teams will develop and finalize the urban design proposal and the open area design creating renderings and graphics. The teams will present the project status, the ongoing open area design and the urban project design, at Interim review 2. Initial urban layout development presentation is also finalized during this activity.
The activities organization and time line is presented in the chart below. (click on the image to enlarge)

The new urban district will have to meet qualitative and quantitative requirements. Qualitative requirements refer to the architecture and urban quality of the proposal. The quality is assessed during the tutoring work with the lecturers and during the interim reviews. Quantitative requirements refers to the performance of the urban district and are the following:
FAR – Floor Area Ratio measures the density of the built environment (the ratio between the total built floor area and the design area). The software UMI used for performance simulations calculates it. It is required to get a FAR of minimum 2.0. Residential buildings will be maximum 7 floors (21m), office buildings maximum 14 floors (42m). Floor height used is 3m for both residential and offices. (The proposed values of FAR and maximum height are different from those stated in the comprehensive plan of Lasnamäe district for academic purposes. Nevertheless the values are still tentative, they could be updated during the initial weeks of the course)
Daylight – Daylight performance is measured using the metric Spatial Daylight Autonomy (sDA). It expresses the percentage of interior space that can be lit solely by daylight (receive the minimum illuminance required) for at least 50% of the occupied hours during the entire year. A space is considered well daylit if sDA is at least 55 (55% of floor area). The software UMI simulate daylight availability in all floor plans of the cluster buildings and calculates sDA. It is required that the minimum sDA for each building of all the urban district is 55.
Energy – The energy requirements used in the course refers to the Estonian regulation Minimum requirements for energy performance available from the following link. Scope of the course is to design low energy buildings. Hence the maximum energy consumption calculated as Primary Energy will be 120 kWh/m2y for residential buildings (multi-apartment) and 130 kWh/m2y) for office buildings. The software UMI calculates operational energy for the entire urban district. Operational energy is calculated for different types of energy consumption as heating, cooling, lighting and equipment. The energy performance of the urban district to take into account is the total energy. It is required that each building fulfill the maximum energy consumption. To perform urban building energy modeling Tallinn weather file and building templates with data about construction and use are provided be the lecturers. The design variables of the urban district that will be varied in order to reach the performance requirements are: size and ratio of building footprints, heights and orientation of buildings, distance between buildings, Window to Wall Ratio (WWR) of the different building facades.
Urban comfort – For urban comfort analysis will be used the metric Universal Thermal Climate Index (UTCI). UTCI express the perceived temperature of a pedestrian in a public open area. The perceived temperature is due to different climatic conditions as air temperature, solar radiation, wind and humidity and takes into account the effect of built environment in modifying local microclimate through shadowing, reflected radiation, own emitted temperature (surface temperature) and wind patterns modification. The chosen public open area will be tested for comfort during winter and summer. The results will give the indications to take into account for the planning of the area. The urban comfort maps generated through analysis will indicate the comfortable open areas for sitting, walking and playing or the less uncomfortable and dangerous for building entrances and pedestrian paths.
Schedule
Below the course schedule is presented. The schedule can be slightly modified depending on the course development. Theoretical lectures about urban design and performance design, also from lecturers and experts outside the course, will be included in the schedule during the first weeks. Changes and additional lecture dates will be notified to students. (click on the image to enlarge)

Recommendations
Students are urged not to use the telephone (chatting/browsing) during lectures and studio work.
Deliverables
For the final presentation (exam) will be done by each team using 5 drawing boards of standard (placard) size A1 (594 mm width x 841 mm height). The number of 5 is mandatory and should not been exceeded. If necessary can be agreed with the lecturers to add 1 more drawing board. The content of the each drawing board is standard and is the following:
1. Relation of the project idea diagram with the surrounding urban morphology. Presentation of the process for the generation of urban layout alternatives. Different urban layout alternatives used in performance studies.
2. Urban daylight and energy performance analysis of the selected urban layout alternatives. Data and charts are used to compare performance.
3. Urban comfort analysis for two period of the year to drive design decisions of a localized open area design.
4. Planning design proposal of the urban layout with the best daylight and energy performance among the selected alternatives. Architectural presentation using renderings and graphics of general plan of the proposal. If necessary part of this project outcome can be presented on drawing board 5.
5. Public open area design of a selected portion of the entire design area on the basis of the urban comfort analysis results. The open area design will show location of terraces, pedestrian paths, playgrounds, green areas, free time areas and entrances to surrounding buildings. Architectural presentation using graphics of plan of the proposal. Additionally one or few renderings can be used.
It is required to
each group that the 5 drawing boards of the project are sent by email to course
lecturers before the exam day in pdf format. The maximum file size for each A1
project board in pdf format is 10Mb. Together with the A1 boards is requested to
deliver an A4 file in pdf format of all the project boards with a maximum file
size of 2Mb.
Grades
Projects/groups exam grades will be assigned in an objective way according the method described hereinafter. However, a certain degree of subjective evaluation cannot be excluded. The course grades will go from 0 to 5 and will be the sum of partial grades given for the following sections:
1. Project idea and urban design quality – from 0 to 1. This section evaluates the quality of the project idea, the urban layout and its relation to the surrounding urban environment. It evaluates as well the relation of the urban design proposal with the project area and program. This section is relative to the material presented on the project boards 1, 4 and 5.
2. Parametric model – from 0 to 1. This section evaluates how the project idea has been included in the parametric model and the efficiency of the parametric model to generate a number of different project variations. This section is relative to the material presented on the project boards 1 and 2.
3. Building performance – from 0 to 1. This section evaluates to which extent the project meet the performance required of FAR, Daylight and energy efficiency and the correctness in performing the performance simulation as presented in the course. It evaluates as well the number and diversity of project variations generated and analyzed. This section is relative to the material presented on the project board 2.
4. Urban comfort – from 0 to 1. This section evaluates the correctness in performing the urban comfort analysis as presented in the course. It evaluates as well how the analysis result have informed the design of the public open area. This section is relative to the material presented on the project boards 3 and 5.
5. Presentation – from 0 to 1. This section evaluates the quality and completeness of the presentation, through diagrams, drawings, charts and images of all the project sections/boards. It evaluates as well the clarity of oral presentation with demonstration by students of the sufficient level of building performance knowledge acquired (relative to what presented in the course). In the next weeks will be posted on the website information and links (some are already present) of material useful to read during the course and for the final presentation.
For the final grade will also taken into account quality and visual effect of printed materials in midterm presentations, participation in course and meeting the time limit requirement in the final presentation. All the students of the same group will receive the same grade. Exceptions can be made for students of the same group with different level of participation in the course and showing different level of building performance knowledge relative to the aspects presented in the course.
Through this sections materials useful for the course are available. They are links to download files to be used in the course, scientific work related to the design and simulation software used, urban design and performance design examples, websites useful for the course. Materials will be added during the course to this section.
Support material
>>>>> Scout - Parametric urban model for view, daylight, comfort and energy real time evaluation
>>>>> Urban Modeling Interface UMI online documentation
>>>>> Research paper - Reinhart, C., Dogan, T., Jakubiec J.A., Rakha, T. and Sang, A. 2013. UMI - An Urban Simulation Environment for Building Energy Use, Daylighting and Walkability. Proceedings of BS2013: 13th Conference of International Building Performance Simulation Association, Chambéry, France, August 26-28, pp. 476-483.
>>>>> Research paper - Dogan, T. and Reinhart, C. 2013. Automated conversion of architectural massing models into thermal ‘shoebox’ models. Proceedings of BS2013: 13th Conference of International Building Performance Simulation Association, Chambéry, France, August 26-28, pp. 3745-3752.
>>>>> Research paper - Saratsis, E., Dogan, T. and Reinhart, C. 2017. Simulation based daylighting analysis procedure for developing urban zoning rules. Building Research & Information, 45(5), pp. 478-491.
>>>>> Research paper - Dogan, T., Reinhart, C. and Michalatos, M. 2012. Urban daylight simulation calculating the daylit area of urban designs. Fifth National Conference of IBPSA-USA, Madison, Wisconsin, August 1-3, 2012, pp. 613-620.
>>>>> Research paper - Amaral, A.R., Rodrigues, E., Rodrigues Gaspair, A. and Gomes A. 2018. Review on performance aspects of nearly zero-energy districts. Sustainable Cities and Society, 43, pp. 406–420.
>>>>> Research paper - Bröde, P., Błażejczyk, K., Fiala, D., Havenith, G., Holmér, I., Jendritzky, G., Kuklane, K. and Kampmann, B. 2013. The Universal Thermal Climate Index UTCI Compared to Ergonomics Standards for Assessing the Thermal Environment. Industrial Health, 51, 16–24.
>>>>> Rhinoceros 3D model of the urban area to use as project environment
>>>>> Source dwg file of the urban area
>>>>> Cadastral dwg file (tiles 128a, 128b, 128g, 128v, 129a, 129v)
>>>>> GH file lecture 06.09
>>>>> GH file lecture 09.09
>>>>> GH file lecture 16.09
>>>>> Video lecture 16.09 (no audio)
>>>>> GH file lecture 23.09
>>>>> Video lecture 23.09
>>>>> Ivan Gavrilov's lecture 30.09.2019
>>>>> GH file to create a double offset
>>>>> Francesco De Luca's lecture 07.10.2019
>>>>> Map-scale+North Rhinoceros file to import
>>>>> Youtube tutorial print PDF in Rhinoceros
>>>>> Tallinn weather file
>>>>> Building template library for simulations
>>>>> GH file to use for UMI test
>>>>> Martin Thalfeldt's lecture 28.10.2019
>>>>> Building template library for simulations 311019 (this replaces the previous one)
>>>>> GH file to read simulation results from UMI
>>>>> Excel chart for building performance result presentation
>>>>> GH file to read simulation results from UMI 04119 (this replaces the previous one + update)
>>>>> GH file for urban comfort analysis
>>>>> Files to install software urban comfort analysis (plug-in Ladybug Tools)
Installation instructions
1 - Download the zip archive file "LadybugFiles.zip"
2 - Right click on the .zip file and if blocked unblock as show in the image below

3 - Open the zip archive file. There are three folders as shown in the image below
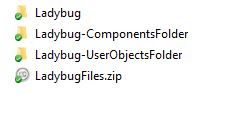 4 - Copy the folder Ladybug in the computer drive C so that the address of the folder is C:\ladybug
5 - Copy the folder Ladybug-ComponentsFolder in Grasshopper>File>Special Folder>Components Folder as shown in the image below
6 - Copy the folder Ladybug-UserObjectsFolder in Grasshopper>File>Special Folder>user Object Folder as shown in the image below

After having copied the folders close Grasshopper and Rhinocers and restart the programs.
>>>>> GH file for urban comfort analysis 181119 (this replaces the previous one)
>>>>> UMI plug-in for Grasshopper fix. This new UMI plug-in for Grasshopper solves the problem of daylight and energy results not corresponding for the same building between UMI interface Grasshopper through the component Get Data. Installing this file it is possible to use the Automatic script in the Grasshopper provided file "GH file to read simulation results from UMI 04119" to read the simulation results from UMI.
Installation instructions:
1 - Right click on the downloaded file, select Properties and in Attributes if the file is blocked, unblock it checking the box and clicking on Apply and Ok.
2 - Copy the file in the folder C:\UMI (overwrite the existing one).
>>>>> GH file for presentation of spatial Daylight Autonomy (sDA) and Primary Energy performance results (building colors and legend)
>>>>> Rhino file 251119
>>>>> GH file 251119
>>>>> Update of GH file for presentation of spatial Daylight Autonomy (sDA) and Primary Energy performance results (building colors and legend). File: sDA-PE-building-colors-legend-251119.gh
>>>>> Update of GH file for presentation of spatial Daylight Autonomy (sDA) and Primary Energy performance results (building colors and legend). File: sDA-PE-building-colors-legend-271119.gh
>>>>> Example of project presentation content and tables organization for interim review and for final exam. File: Example of project tables organization.pdf
>>>>> Map-scale+North Rhinoceros file to import
>>>>> Youtube tutorial print PDF in Rhinoceros
>>>>> Tallinn weather file
>>>>> Building template library for simulations
>>>>> GH file to use for UMI test
>>>>> Martin Thalfeldt's lecture 28.10.2019
>>>>> Building template library for simulations 311019 (this replaces the previous one)
>>>>> GH file to read simulation results from UMI
>>>>> Excel chart for building performance result presentation
>>>>> GH file to read simulation results from UMI 04119 (this replaces the previous one + update)
>>>>> GH file for urban comfort analysis
>>>>> Files to install software urban comfort analysis (plug-in Ladybug Tools)
Installation instructions
1 - Download the zip archive file "LadybugFiles.zip"
2 - Right click on the .zip file and if blocked unblock as show in the image below

3 - Open the zip archive file. There are three folders as shown in the image below

5 - Copy the folder Ladybug-ComponentsFolder in Grasshopper>File>Special Folder>Components Folder as shown in the image below
6 - Copy the folder Ladybug-UserObjectsFolder in Grasshopper>File>Special Folder>user Object Folder as shown in the image below

After having copied the folders close Grasshopper and Rhinocers and restart the programs.
>>>>> GH file for urban comfort analysis 181119 (this replaces the previous one)
>>>>> UMI plug-in for Grasshopper fix. This new UMI plug-in for Grasshopper solves the problem of daylight and energy results not corresponding for the same building between UMI interface Grasshopper through the component Get Data. Installing this file it is possible to use the Automatic script in the Grasshopper provided file "GH file to read simulation results from UMI 04119" to read the simulation results from UMI.
Installation instructions:
1 - Right click on the downloaded file, select Properties and in Attributes if the file is blocked, unblock it checking the box and clicking on Apply and Ok.
2 - Copy the file in the folder C:\UMI (overwrite the existing one).
>>>>> GH file for presentation of spatial Daylight Autonomy (sDA) and Primary Energy performance results (building colors and legend)
>>>>> Rhino file 251119
>>>>> GH file 251119
>>>>> Update of GH file for presentation of spatial Daylight Autonomy (sDA) and Primary Energy performance results (building colors and legend). File: sDA-PE-building-colors-legend-251119.gh
>>>>> Update of GH file for presentation of spatial Daylight Autonomy (sDA) and Primary Energy performance results (building colors and legend). File: sDA-PE-building-colors-legend-271119.gh
>>>>> Example of project presentation content and tables organization for interim review and for final exam. File: Example of project tables organization.pdf
Student works
>>>>> Link to access the works developed by the student groups for the final review.
